The Ambulatory Glucose Profile (AGP) is a helpful report that shows your glucose trends over time. It helps you and your healthcare provider spot patterns, make informed choices, and adjust your diabetes management plan.
What is an Ambulatory Glucose Profile (AGP)?
The AGP is a standardised visual report created from Continuous Glucose Monitoring (CGM) data, usually collected over 14 days or more, covering a 24-hour grid. It shows key details about your glucose levels, making it easier to see patterns and areas that might need attention.
Unlike periodic fingerprick tests, which provide single-point readings, the AGP reports ongoing trends and patterns throughout the day and night. The AGP report provides information on the quality of your glucose control. It can guide you and your diabetes care team to decide on further steps to improve your glucose control.
What does the AGP report show?
The AGP report highlights several key areas:
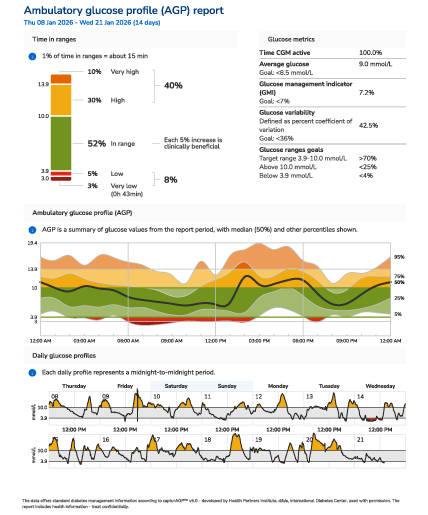
- Time in Range (TIR): Time in range shows the percentage of time your glucose stays within the target range (usually 3.9-10.0 mmol/L). The goal is to be in range at least 70% of the time, with less than 4% of the time below 3.9 mmol/L and less than 25% above 10.0 mmol/L.
- Active time: Active time tells you how long your CGM was collecting data. For accurate results, your CGM should be active at least 70% of the time.1
- Average glucose: This is the overall average of all your glucose readings during the selected time period.
- Glucose Management Indicator (GMI): GMI gives a calculated estimate of your current HbA1c level based on your CGM data from the past 14 days.2 It’s not a replacement for lab tests but offers a snapshot.
- Glucose variability: The variability shows how much your glucose levels go up and down. Less variability – below 36% – is better, as it means your glucose is more stable.2
- Glucose range goals: Recommended percentage of time values for the different glucose ranges.
- AGP Chart: The daily glucose profiles of 14 days are combined into a picture that reflects 24 hours. The bold line represents the median glucose values, and the darker and lighter shaded areas above and below represent the distribution of the glucose values. The broader those areas are, the more widespread the distribution of measured glucose.
Your daily glucose profiles
The AGP also displays individual daily glucose profiles, with colour-coded alerts:
- Green: Glucose values within the target range.
- Red: Low glucose readings (below 3.9 mmol/L).
- Orange: High glucose readings (above 10.0 mmol/L).
These profiles help identify specific events or patterns, such as frequent highs after meals or lows during the night. Ideally, your glucose profile should lie within the target range, be as narrow as possible, and remain relatively flat.3
How to interpret the AGP chart3
The AGP summarizes glucose data from the past 14 days into a 24-hour visualization, showing patterns and variability:
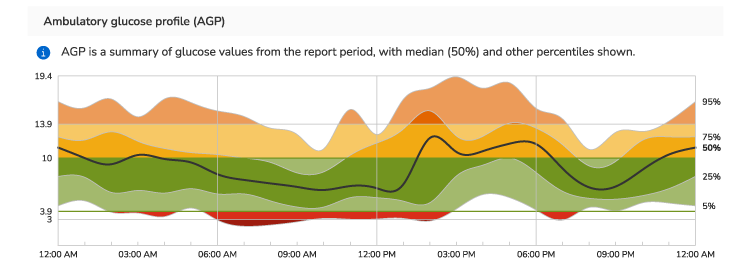
- Target Range: The green shaded area represents the individual glucose range (3.9-10.0 mmol/L).1
- Median Line: The bold middle line shows the midpoint of all glucose readings.
- 50% Range: The darker green shaded area around the median line includes half of all glucose values.
- 90% Range: The lighter shaded areas extending into light green and yellow above and below the darker band represent 90% of glucose values.
- 5% Extremes: The outer edges of the shaded areas reflect the lowest and highest glucose readings during the report period.
To identify the time of the day when most fluctuations occur, look at the upper boundary of the darker shaded area of the average daily glucose profile. This line represents 25% of your glucose values and ideally should not cross the upper border of your target range.
To get the most from your AGP report, follow these steps:
- Check active time: Make sure your CGM was collecting data at least 70% of the time.
- Spot patterns: Look for recurring patterns. For example, are you often high after meals or low overnight?
- Check time in range Look at the percentage of time you spent in the target range (usually 3.9-10.0 mmol/L). Aim for at least 70% in range, with less than 4% below 3.9 mmol/L and less than 25% above 10.0 mmol/L. Staying in range more often can reduce the risk of complications and improve your overall well-being.1
Always talk with your healthcare provider before making changes to your treatment plan, as goals can vary depending on your personal needs.
Things to keep in mind
The AGP is a powerful tool with some limitations:
- Missing data due to device removal or connectivity issues can affect accuracy.
- Diet, exercise, stress, and medication usage can impact glucose readings.
- AGP is viewed best alongside other health information, like your HbA1c and overall lifestyle.
The AGP helps you understand how your glucose behaves throughout the day and night. By understanding this report, you can work with your healthcare provider to fine-tune your diabetes care, improve your glucose control, and feel more confident managing your diabetes.
References:
- Bergenstal RM, Beck RW, Close KL, Grunberger G, Sacks DB, Kowalski A, et al. Glucose Management Indicator (GMI): A New Term for Estimating A1C From Continuous Glucose Monitoring. Diabetes Care. 2018 Nov;41(11):2275–80.
- Battelino T, Danne T, Bergenstal RM, Amiel SA, Beck R, Biester T, et al. Clinical Targets for Continuous Glucose Monitoring Data Interpretation: Recommendations From the International Consensus on Time in Range. Diabetes Care. 2019 Aug;42(8):1593–603.
- Kröger J, Reichel A, Siegmund T, Ziegler R. Clinical Recommendations for the Use of the Ambulatory Glucose Profile in Diabetes Care. J Diabetes Sci Technol. 2020 May;14(3):586–94.
- Szmuilowicz ED, Aleppo G. Stepwise approach to continuous glucose monitoring interpretation for internists and family physicians. Postgrad Med. 2022 Nov;134(8):743–51.
How helpful did you find this training?
Still having trouble? Contact us
*Some mobile phone operators may charge or restrict access for calls to these numbers. Calls to these numbers are subject to a local call charge, depending on your mobile network provider.
** This number is only for UK customers who are currently out of the country on a short term basis, please be aware that we cannot send replacement products abroad and advise that you take spare supplies with you. To improve the quality of our service, calls received or made by Roche Diagnostics Limited may be recorded.
Insulin Pump Consumable Orders
Phase out of
Blood Glucose Monitoring
UK: 0800 701 000* or 020 3499 6159**
Ireland: 1 800 709 600* or 01 5410379**
Monday to Friday 8am-6pm excluding bank holidays.
Continuous Glucose Monitoring
UK: 0800 0211 241*
Ireland: 1 800 121 416*
Monday to Friday 8am-6pm excluding bank holidays.
Insulin Pumps
UK: 0800 731 2291* (option 2)
Ireland: 1 800 882 351* (option 2)
You can reach us 24/7, 365 days
If you're a UK customer outside the UK, please call 0044 (0)1444 256019 (option 2)**