How to use the graphs in the Accu-Chek SmartGuide App

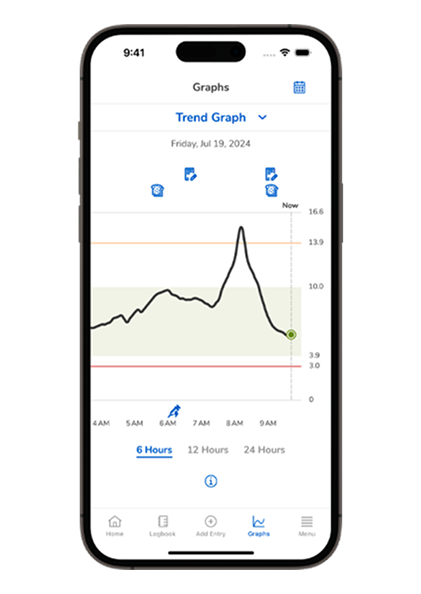
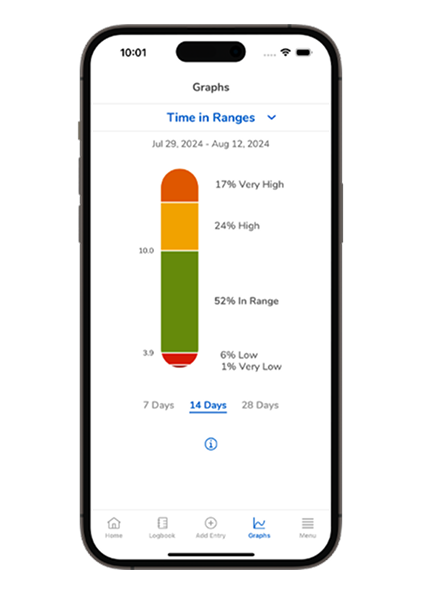
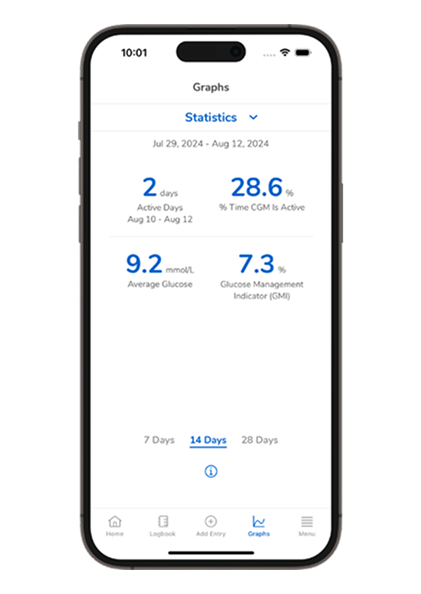
The Accu-Chek SmartGuide app provides a clear summary of your diabetes data at a glance. Get a clear overview of your glucose curve, trends, and Time In Range(TIR) with simple graphs to help you learn more about your diabetes. Statistics like your Glucose Management Indicator (GMI) help you understand how your therapy is working.1 Tap the Graphs icon in the tab bar of the Home screen to see different types of data:

Screenshot of the SmartGuide apps Trend Graph screen.

Trend graph

  • See an extended view of the SmartGuide trend graph from the Home screen.
  • To view your Trend Graph in the app, tap Graphs, select Trend Graph from the drop-down menu, and choose which time interval you want to see.
  • This graph shows your continuous glucose data from the past 6, 12, or 24 hours.
  • Swiping the graph to the right shows your glucose data from the past. Use the Calendar icon in the top right corner, to select and see your glucose data for a specific day.
  • It can also include your Logbook entries, to add context to the data.

 Screenshot of the SmartGuide apps Time in Range  screen.

Time in range

  • See how much time your glucose values stayed within range, including your personal target range, over the past 7, 14, or 28 days.
  • The goal is to spend as much time as possible In Range (the green area of the graph).

Screenshot of the SmartGuide apps’ Graphs screen displaying statistics like CGM time and average blood sugar values.

Statistics

  • View your CGM usage and key metrics for the past 7, 14, or 28 days.
  • See your active CGM time, average values, and glucose management indicator (GMI).

Screenshot of the SmartGuide apps’ Help section featuring a highlight over the User Manual.

Tap the (i) icon for more information about the screen's content and how to use it.

Group-icon

You can always refer to the User’s Manual in the Help section of the Menu.

1. Bergenstal RM, Beck RW, Close KL, Grunberger G, Sacks DB, Kowalski A, Brown AS, Heinemann L, Aleppo G, Ryan DB, Riddlesworth TD, Cefalu WT. Glucose Management Indicator (GMI): A New Term for Estimating A1C From Continuous Glucose Monitoring. Diabetes Care. 2018 Nov;41(11):2275-2280

Still having trouble? Contact us

*Some mobile phone operators may charge or restrict access for calls to these numbers. Calls to these numbers are subject to a local call charge, depending on your mobile network provider. 
** This number is only for UK customers who are currently out of the country on a short term basis, please be aware that we cannot send replacement products abroad and advise that you take spare supplies with you. To improve the quality of our service, calls received or made by Roche Diagnostics Limited may be recorded.

Insulin Pump Consumable Orders

Visit our order page, or call UK: 0800 731 2291* (option 1), Ireland: 1 800 882 351* (option 1)

Monday to Friday 8:30am-5pm excluding bank holidays. 
If you're a UK customer outside the UK, please call 0044 (0)1444 256019 (option 1)**

Blood Glucose Monitoring

UK: 0800 701 000* or 020 3499 6159**
Ireland: 1 800 709 600* or 01 5410379**

Monday to Friday 8am-6pm excluding bank holidays.  

Send a message
Continuous Glucose Monitoring

UK: 0800 0211 241*
Ireland: 1 800 121 416*

Monday to Friday 8am-6pm excluding bank holidays.  

Send a message
Insulin Pumps

UK: 0800 731 2291* (option 2) 
Ireland:  1 800 882 351* (option 2)

You can reach us 24/7, 365 days
If you're a UK customer outside the UK, please call 0044 (0)1444 256019 (option 2)** 

Send a message